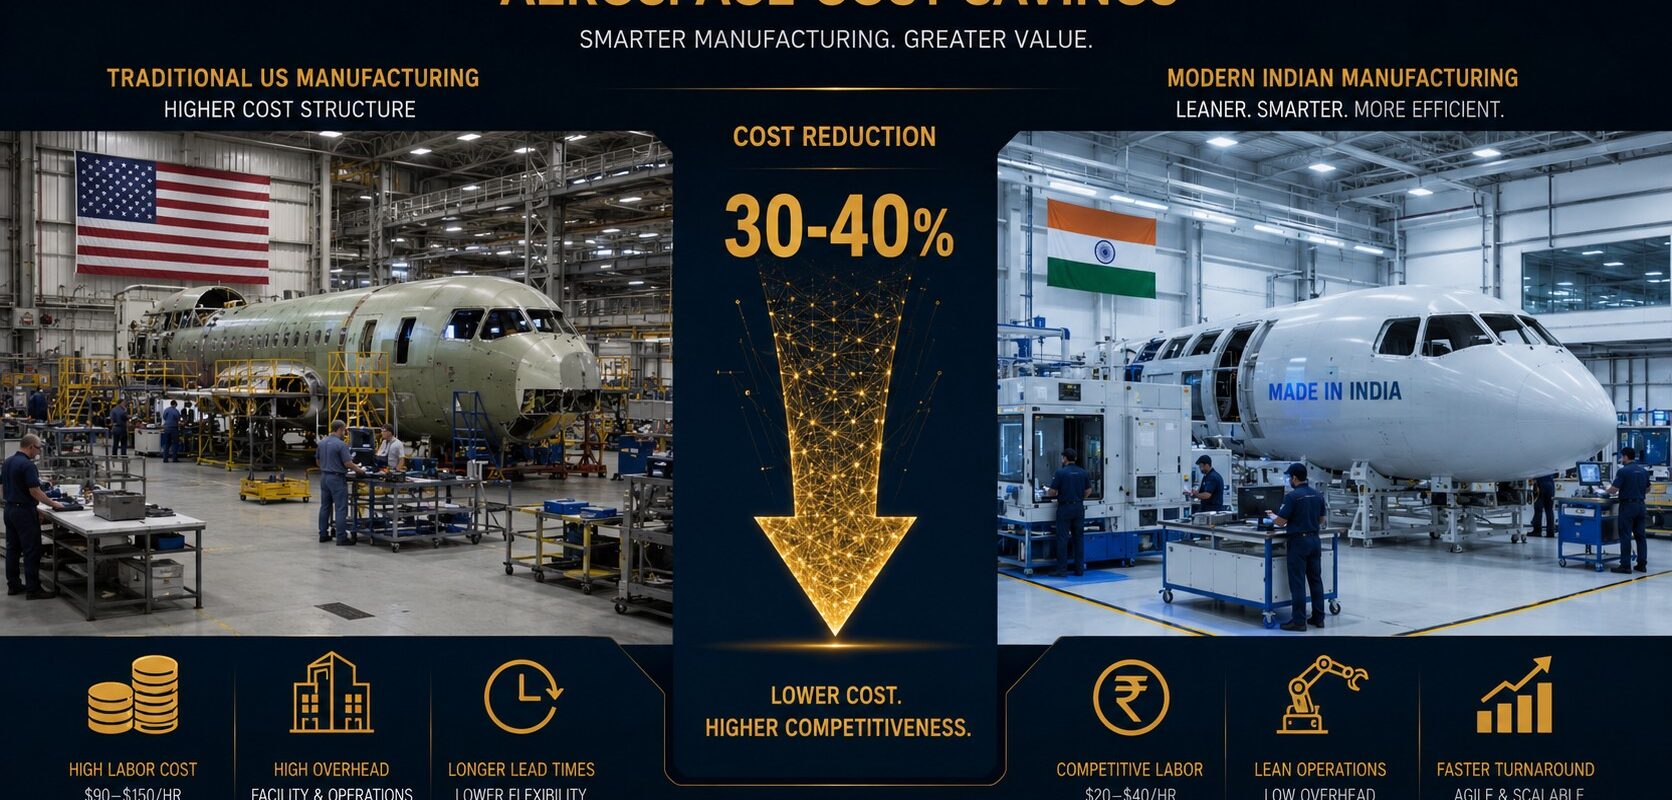
5 Proven Strategies to Reduce Aerospace Manufacturing Costs by 40%
Aerospace manufacturers are under relentless margin pressure. Raw material costs have risen sharply since 2022, skilled labor shortages continue across U.S. machining facilities, and OEM customers push back harder than ever on price increases. For Tier 1 and Tier 2 suppliers, the question is no longer whether to optimize costs — it is how to do it without touching quality, compliance, or delivery reliability.
This guide details five field-tested strategies to reduce aerospace manufacturing costs by 25-40%. Every approach has been validated through actual client engagements, not theoretical modeling. Where relevant, we include real salary benchmarks, ROI calculations, and a reference to the Orluck Industries case study — one of the clearest real-world demonstrations of what disciplined aerospace sourcing can achieve.
Max Cost Reduction Achieved
Lower Labor Cost in India vs. U.S.
Typical Time to First Savings
Capacity Scale Without New CapEx
This article is written for VP-level operations, procurement directors, and supply chain managers at U.S. aerospace manufacturers with $10M+ in annual machined-parts spend who need to demonstrate measurable cost reduction without compromising AS9100 or NADCAP compliance.
Leverage Low-Cost Country Sourcing — Without Sacrificing Quality
The single highest-impact lever available to aerospace manufacturers today is strategic low-cost country (LCC) sourcing, specifically from India’s advanced manufacturing sector. This is not a race to the bottom. When executed correctly — through NADCAP-certified, AS9100 Rev D-registered facilities — LCC sourcing delivers identical part quality at a fraction of the domestic cost.
The Labor Cost Reality: U.S. vs. India
The wage differential is the most immediate driver of cost reduction. The table below compares typical fully-loaded annual compensation for aerospace manufacturing roles in the U.S. against equivalent roles in India’s aerospace machining corridor (Bengaluru, Pune, Hyderabad, and Chennai).
| Role | U.S. Annual Cost (USD) | India Annual Cost (USD) | Savings |
|---|---|---|---|
| CNC Machinist (5-axis) | $72,000 – $95,000 | $8,500 – $14,000 | 81–88% |
| Quality Engineer (AS9100) | $85,000 – $110,000 | $12,000 – $18,000 | 82–86% |
| Aerospace Structural Welder | $68,000 – $90,000 | $9,000 – $16,000 | 79–87% |
| Manufacturing Engineer | $95,000 – $125,000 | $15,000 – $24,000 | 80–85% |
| Supply Chain Analyst | $70,000 – $90,000 | $10,000 – $17,000 | 80–86% |
| Blended Workforce Average | $78,000 – $102,000 | $11,000 – $18,000 | 55–88% |
These figures use fully loaded costs including benefits, employer taxes, and overhead allocation. India figures reflect tier-2 and tier-3 city salary benchmarks where aerospace manufacturing clusters are most concentrated.
Quality Is Not a Variable — It Is a Requirement
The objection most U.S. procurement teams raise is quality risk. This concern, while understandable, is largely a product of outdated assumptions. India’s aerospace manufacturing ecosystem has matured substantially over the past 15 years. Leading facilities hold:
- AS9100 Rev D registration — the international quality management standard for aviation, space, and defense
- NADCAP accreditation for special processes including heat treatment, chemical processing, non-destructive testing, and welding
- ITAR compliance registration where export-controlled data is involved
- DGCA and CEMILAC approvals for indigenous aerospace programs, signaling domestic regulatory rigor
Never source on price alone. Qualify suppliers the same way you would a domestic facility: audit the QMS, review NADCAP scope, inspect first-article reports, and validate dimensional capability on production-representative parts before committing volume.
Which Parts Are Best Suited for LCC Sourcing?
- High-volume precision CNC machined components (brackets, housings, fittings)
- Sheet metal fabrications and structural panels
- Standard and semi-standard hardware assemblies
- Non-flight-critical secondary structures
- Tooling, fixtures, and ground support equipment
Parts with very short pull-lead-times, classified ITAR restrictions without DDTC-compliant partners, or single-source material requirements may require a phased qualification approach rather than immediate transition.
To understand the full financial impact of transitioning your parts spend, see our ROI and Savings Calculator.
Implement 24/7 Operations Using Time Zone Leverage
One of the most underutilized advantages of U.S.-India partnerships is the natural time zone offset. India Standard Time (IST) runs 9.5 to 12.5 hours ahead of U.S. time zones. Structured correctly, this creates a near-continuous production cycle without requiring any domestic overtime, second-shift premiums, or additional headcount on U.S. soil.
How a 24-Hour Production Cycle Works in Practice
| Time Zone | Local Hours Active | Corresponding U.S. EST Hours | Activity |
|---|---|---|---|
| U.S. (EST) | 8:00 AM – 5:00 PM | 8:00 AM – 5:00 PM | Engineering, customer-facing ops, program management |
| India (IST) | 6:30 PM – 3:30 AM IST | 8:00 AM – 5:00 PM EST (same day) | Overlap window: design review, quality sign-off, RFQ processing |
| India (IST) | 7:00 AM – 6:00 PM IST | 8:30 PM – 7:30 AM EST | Full machining shift, fabrication, inspection, shipping prep |
| Net Coverage | ~20 productive hours per calendar day with 2-4 hour overlap for coordination | ||
Quantified Cost Impact of 24/7 Operations
A U.S. facility running a second shift to match this output would incur:
- 10-15% shift differential on second-shift wages
- Additional supervision, quality, and maintenance headcount
- Higher workers’ compensation and insurance premiums
- Accelerated equipment wear from continuous operation
By contrast, the India-based facility operates during its standard first shift — meaning no premium labor costs whatsoever. For a manufacturer with $5M in annual machining spend, eliminating overtime and second-shift premiums alone can represent $400,000-$750,000 in annualized savings.
Designate a U.S.-based program coordinator whose primary role is the 8:00-9:30 AM overlap window with the India team. This single structural decision eliminates the majority of communication delays that cause schedule misses in offshore partnerships.
Scale Capacity Without Capital Expenditure
Building or expanding a U.S. aerospace machining facility is a multi-year, capital-intensive commitment. A new CNC machining bay with 4-6 five-axis centers, metrology equipment, and supporting infrastructure can cost $8M-$15M before a single part ships. The ROI on that investment is measured in years, not months — and it is entirely illiquid if demand shifts.
The CapEx Comparison
| Expansion Method | Upfront Investment | Time to First Part | Capacity Flexibility | Risk Profile |
|---|---|---|---|---|
| New U.S. Facility / Expansion | $8M – $20M+ | 18 – 36 months | Low (fixed asset) | High (demand-driven) |
| U.S. Subcontractor Network | $200K – $600K (qualification) | 3 – 9 months | Medium | Medium |
| India LCC Partner (Qualified) | $50K – $150K (qualification + travel) | 90 – 180 days | High (up to 10x scale) | Low-Medium |
What 10x Capacity Scale Actually Means
A qualified India-based manufacturing partner operating at 200-300 employees with a modern 5-axis machining center inventory can absorb volume spikes that would require years and tens of millions of dollars to replicate domestically. When an OEM issues a production acceleration directive, your domestic-only competitors are constrained. With an established LCC partner, you respond with a purchase order.
Explore how this model works operationally on our How It Works page.
Assume a $2M annual machined-parts program currently produced domestically at $100/part (20,000 parts/year). After qualifying an India partner at an average landed cost of $62/part (including freight, duty, and inspection), annual savings equal $760,000 on a qualification investment of approximately $80,000. That is a 9.5x first-year ROI.
Optimize Your Supply Chain Through Systematic Auditing
Before optimizing any external supplier relationship, aerospace manufacturers must first understand their own internal cost architecture. A rigorous supply chain audit regularly surfaces 15-25% in recoverable cost that was invisible in the P&L — hidden in process inefficiencies, non-conformance rework, redundant inspection steps, and supplier pricing that has never been benchmarked.
What a Comprehensive Supply Chain Audit Covers
- Precision machining spend analysis — part-level cost benchmarking against market rates for identical or comparable geometry
- Make vs. buy analysis — identifying which operations are non-core and candidates for outsourcing
- Supplier consolidation opportunities — reducing the total supplier count to increase leverage and simplify quality management
- Non-conformance cost mapping — quantifying the true cost of scrap, rework, and supplier-caused defects
- Lead-time and inventory carrying cost analysis — identifying where excess safety stock is masking process variability rather than solving it
- Freight and logistics optimization — particularly critical when transitioning to international sourcing
Common Findings and Their Cost Impact
| Audit Finding | Typical Frequency | Average Annual Cost Impact |
|---|---|---|
| Uncompetitive single-source supplier pricing | Very Common | 8 – 18% of affected spend |
| Excess safety stock / inventory carrying cost | Common | $150K – $800K depending on spend |
| Uninspected supplier non-conformance costs | Common | 3 – 7% of total parts spend |
| Duplicated inspection steps (supplier + internal) | Moderate | $50K – $250K/year in labor |
| Suboptimal inbound freight routing | Common for international | 4 – 12% of freight spend |
View the full range of supply chain and sourcing services we offer to aerospace manufacturers at every tier.
Structure Retainer Contracts to Lock In Long-Term Savings
Most aerospace procurement teams default to transactional, purchase-order-by-purchase-order sourcing. This approach is operationally familiar but structurally expensive. Every spot buy triggers a fresh round of quoting, supplier setup costs, and scheduling negotiation — costs that are real but rarely captured in part-level pricing.
Retainer vs. Spot-Buy: A Direct Cost Comparison
| Cost Element | Spot-Buy Model | Annual Retainer Model | Savings |
|---|---|---|---|
| Part unit pricing | Market rate per PO | Committed volume discount | 10 – 20% |
| Sourcing overhead (per transaction) | $400 – $1,200/PO | Amortized across year | 60 – 80% reduction |
| Supplier setup / scheduling premium | Charged per run | Absorbed in retainer rate | $50 – $300/run |
| Rush order premium frequency | High (reactive) | Low (planned) | 25 – 40% fewer rush fees |
| Total Annualized Savings | Baseline | Retainer model | 20 – 30% of total spend |
What a Well-Structured Retainer Contract Includes
- Annual committed volume bands with pricing tiers that reward volume consistency
- Locked-in lead times — your supplier plans capacity for you, eliminating scheduling volatility
- Dedicated quality engineer assigned to your account with documented escalation paths
- Quarterly business reviews (QBRs) to track KPIs and adjust scope as programs evolve
- Price adjustment mechanisms tied to published indices (e.g., PPI for metals) to prevent disputes
- First-call capacity rights during your supplier’s peak periods — critical for aerospace program acceleration scenarios
Ready to model what a retainer structure would save your organization? Start with our ROI Savings Calculator or contact our team for a custom analysis.
Case Study: Orluck Industries
How a Mid-Tier Aerospace Supplier Reduced Manufacturing Costs by 38% in 14 Months
Orluck Industries is a U.S.-based Tier 2 aerospace supplier specializing in precision structural assemblies for commercial and defense programs. Facing a combination of domestic labor cost escalation and OEM-imposed target price reductions, the company needed to reduce its cost of goods sold by a minimum of 30% within 18 months — without disrupting active program deliveries.
The Challenge
Orluck’s machining spend was concentrated in three domestic facilities, all operating at or near capacity. Adding domestic headcount would increase fixed costs. Refusing the OEM’s target price reduction meant losing a multi-year contract worth $12M annually.
The Approach
- Conducted a full supply chain audit across all three facilities
- Identified 47 part numbers suitable for immediate India sourcing qualification
- Qualified two NADCAP-certified machining partners in Pune within 90 days
- Structured a 3-year retainer contract with committed volume bands and locked pricing
- Implemented a 24/7 operations model with a designated U.S. program coordinator
Overall Cost Reduction
Annualized Savings
Time to Full Realization
Quality Escapes During Transition
On-Time Delivery Maintained
Read the full breakdown in our Case Studies section, including first-article qualification timelines, supplier scorecard methodology, and lessons learned during the transition.
Combined ROI: What All 5 Strategies Deliver Together
Applied independently, each strategy delivers meaningful savings. Applied together — as Orluck Industries demonstrated — the compounding effect is substantially greater. The table below models the combined impact for a hypothetical $10M annual machined-parts spend.
| Strategy | Applicable Spend | Estimated Savings % | Annual Savings (USD) |
|---|---|---|---|
| LCC Sourcing (India) | $6M (60% of spend) | 35% | $2,100,000 |
| 24/7 Operations (overtime elimination) | $10M (labor component) | 6% | $600,000 |
| CapEx Avoidance (annualized) | $12M (avoided investment) | N/A | $800,000 (cost of capital) |
| Supply Chain Audit Recoveries | $10M | 8% | $800,000 |
| Retainer Contract Optimization | $10M | 5% | $500,000 |
| Total Combined Impact | — | ~38% | $4,800,000 |
These figures are conservative estimates based on real-world client outcomes. Individual results vary based on current supplier mix, part complexity, and volume. Use our interactive ROI calculator to model your specific program.
Frequently Asked Questions
Explore Related Resources
Ready to Reduce Your Aerospace Manufacturing Costs?
Get a custom cost reduction analysis for your parts spend. Our team will identify which of your current programs are the strongest candidates for 25-40% savings and build a qualification roadmap with no disruption to active deliveries.